
Now we know greenhouse gases are the culprits! Let’s look at how long they live in the atmosphere and how scientists measure them.
Greenhouse gases in the atmosphere are measured by observatories on Earth. The Mauna Loa observatory in Hawaii has been recording carbon dioxide (CO₂) levels since the 1950s (Figure 3.5.1).
Greenhouse gases are also measured in the air. The High Altitude Lidar Observatory (HALO) is an instrument that is flown on an aircraft. It measures water vapor, methane, and particles with laser beams.
Finally, satellites measure the amount and distribution of carbon dioxide from space.
Based on instrument measurements and paleoclimate records such as ice cores, scientists have a clearer picture of how CO2 levels are changing.
Carbon Dioxide
The Industrial Revolution in 1750 had a huge impact on emissions. During the Industrial Revolution, hundreds of factories were built in the U.S. and Europe.
These factories pumped tons of CO₂ into the atmosphere. Since then, CO₂ levels have increased even more. They went from 280 parts per million to 430 parts per million in 2025. That is a whole lot more!

About half of human-made CO₂ emissions are absorbed by our oceans over a few decades. The remaining linger for hundreds of thousands of years. Then it is slowly absorbed by Earth’s natural processes.
As you can see, the more CO₂ we pump each year, the more we are adding to already existing levels in the atmosphere.
Other Greenhouse Gases
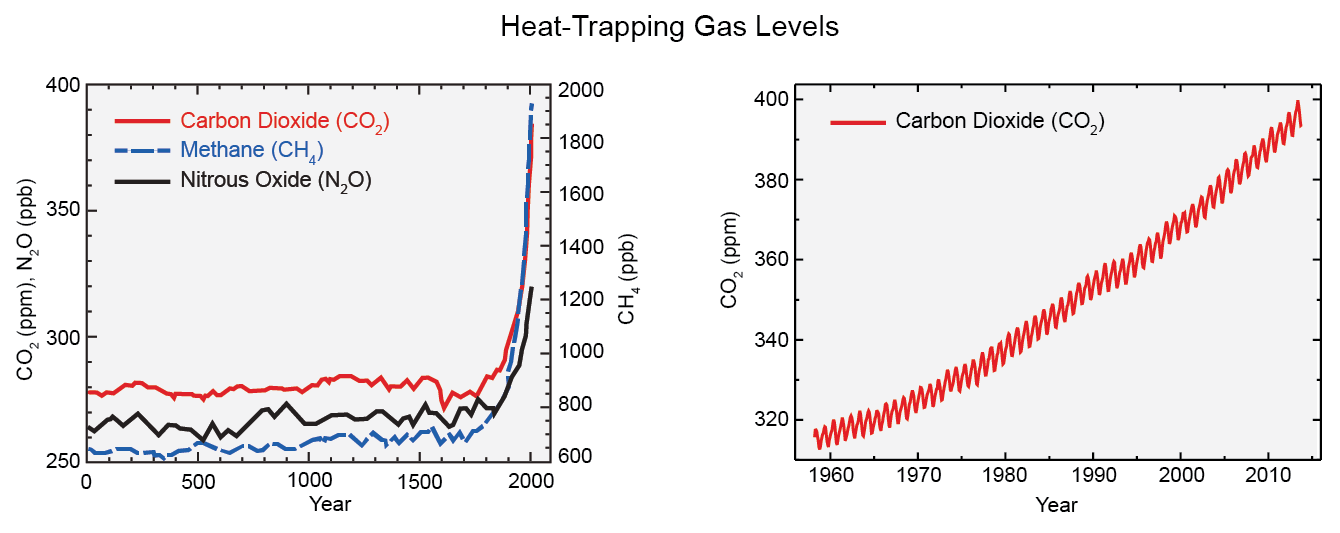
Methane concentrations have gone up from a pre-industrial level of 700 parts per billion (ppb) to 1800. That is more than double! Nitrous oxide has gone up from 270 ppb to 320 ppb.
Both methane and nitrous oxide are stronger than carbon dioxide and trap more heat. Fortunately, methane lives in the atmosphere for 12 years, and nitrous oxide for about 112 years.
The graph below shows levels of the three main greenhouse gases over the past 2000 years (left) and carbon dioxide from 1960-2012 (right).
Fluorinated gases can last anywhere from less than a year to hundreds of thousands of years. Particles like dust and soot only last for a few days to weeks.
Water vapor is the largest greenhouse gas, but it has the shortest lifetime. Unlike other greenhouse gases, water vapor condenses and falls back as rain or snow.
Now that we understand more about greenhouse gases, let's look at how scientists use this information in their models.
Summary
- Scientists measure greenhouse gases in the atmosphere through ground-based stations, airplanes, and satellites.
- Greenhouse gases in the atmosphere have increased significantly since the 18th century when the industrial era began.
- While methane and nitrous oxide remain in the atmosphere for tens to hundreds of years, carbon dioxide stays for hundreds of thousands of years.
Now that we know greenhouse gases are the culprits, let us look at how long they live in the atmosphere and how scientists measure and track them.
Greenhouse gas concentrations in the atmosphere are measured by ground-based stations. The Mauna Loa observatory in Hawaii has been recording carbon dioxide (CO₂) levels continuously since the 1950s.
Greenhouse gases can be monitored from the air, too. The High Altitude Lidar Observatory (HALO) is an airborne instrument that is flown on an aircraft. By shooting a laser beam that bounces off gas molecules, HALO measures concentrations of water vapor, methane, and floating particles.
Finally, satellites such as NASA's OCO-2 and OCO-3 measure carbon dioxide concentration and distribution from space.
Based on instrument measurements and paleoclimate records such as ice cores, scientists have a clearer picture of how greenhouse gas levels are changing.
Carbon Dioxide (CO₂)
Before the start of the Industrial Revolution, atmospheric levels of CO₂ were at 280 parts per million. As of 2025, it is 430 parts per million, which is equivalent to an extra 1170 gigatons of CO₂ in just the past 300 years!
Fig 3.5.2 shows that for the past 800,000 years, carbon dioxide levels (in blue) and temperatures (in red) have been tracking each other. When either one increases, the other rises as well, and is based on paleoclimate records. What does the blue line on the right edge of the graph tell us?
About half of manmade CO₂ emissions are absorbed by our oceans over a few decades. The remaining lingers for hundreds of thousands of years and is slowly absorbed by our Earth’s natural processes. As you can see, the more CO₂ we produce each year, the more we are adding to already existing levels of the gas in the atmosphere.
Other Greenhouse Gases
Methane concentrations have gone up from a pre-industrial level of 700 ppb (parts per billion) to 1800 ppb. Nitrous oxide, another greenhouse gas, has gone up from a pre-industrial level of 270 ppb to 320 ppb.
Both methane and nitrous oxide are more potent than carbon dioxide and trap more heat. Fortunately, methane lives in the atmosphere for 12 years, while nitrous oxide lives for an average of 112 years.
Fig 3.5.3 shows levels of the three main greenhouse gases over the past 2000 years (left) and carbon dioxide from 1960-2012 (right).
Fluorinated gases can last anywhere from less than a year to hundreds of thousands of years, while particles like dust and soot only last for a few days to weeks.
Water vapor, though the largest greenhouse gas, has a very short lifetime. Unlike other greenhouse gases, water vapor condenses and falls back as rain or snow.
Now that we have understood more about greenhouse gases, let's look at how scientists use this information in their models to project future impacts.