
Did you know that some small island countries such as Kiribati and Marshall Islands in the Pacific Ocean are getting smaller?
Sea levels are rising and swallowing up their coastlines. High tides are also causing flooding of coastal villages. This also leads to the contamination of freshwater ponds.
Measuring sea levels is not easy because the ocean is always moving with tides, waves, and winds. Let's find out how scientists track the changes and what we know so far.
How Is Sea Level Measured?
Today tide gauges along the coast compute sea-level changes by bouncing audio signals off the water’s surface.
Satellites with altimeters measure changes in sea levels across wider parts of our oceans. They bounce radar signals off the water’s surface. Then the satellites measure the round-trip time.
What Does The Data Show?
Scientists have found that the sea level has risen by at least eight inches in the past hundred years.
The mean sea level is increasing at a rate of 0.13 inches (3.3 millimeters) per year around the world.
Flooding in coastal areas during high tides has become more common. In the U.S high tide flooding is 300% - 900% more frequent than it was 50 years ago. That means coastal cities have are getting flooded more often these days.

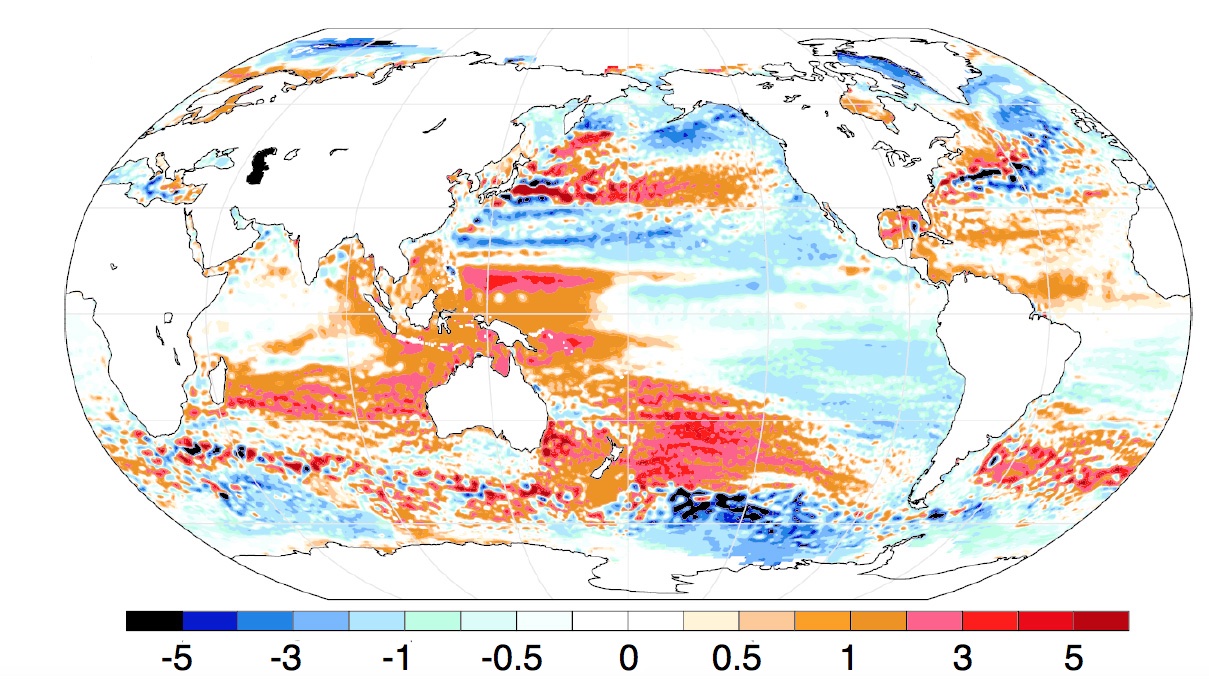
The map below shows sea-level trends in millimeters per year.
The warm colors tell us that the rate of sea-level rise was greater than average. The cool colors tell that sea-level rise was less than average.
We will see later what is causing sea levels to rise. For now, let’s continue our search for evidence and examine extreme weather patterns next!
Summary
- Sea levels are measured using tide gauges and satellites.
- Data shows that since 2006, sea levels have been rising at an average of 3.3 millimeters per year.
- Rising seas are also causing coastal flooding during high tides.
Did you know that small island nations such as Kiribati and the Marshall Islands in the Pacific are shrinking in size?
This is because rising sea levels are swallowing up their coastlines. The high tides also flood coastal villages and contaminate freshwater ponds.
Measuring sea levels is not easy, as the ocean is constantly in motion due to tides, waves, and winds. So, how do scientists track these changes?
How Is Sea Level Measured?
Tide gauges have been used to record sea levels since the 1800s.
In its simple form, it looks like a long scale placed in the water. Today, electronic tide gauges do the same job more precisely by bouncing audio signals off the ocean’s surface.
Satellites also measure sea level across the globe. They use instruments called altimeters, which bounce radar signals off the water’s surface and measure how long it takes for the signal to return.
What Does The Data Show?
These instruments reveal that global sea level has risen by at least 8 inches over the past century -- and it continues to rise at the rate of 0.13 inches (3.3 mm) per year (Fig. 2.5.2).
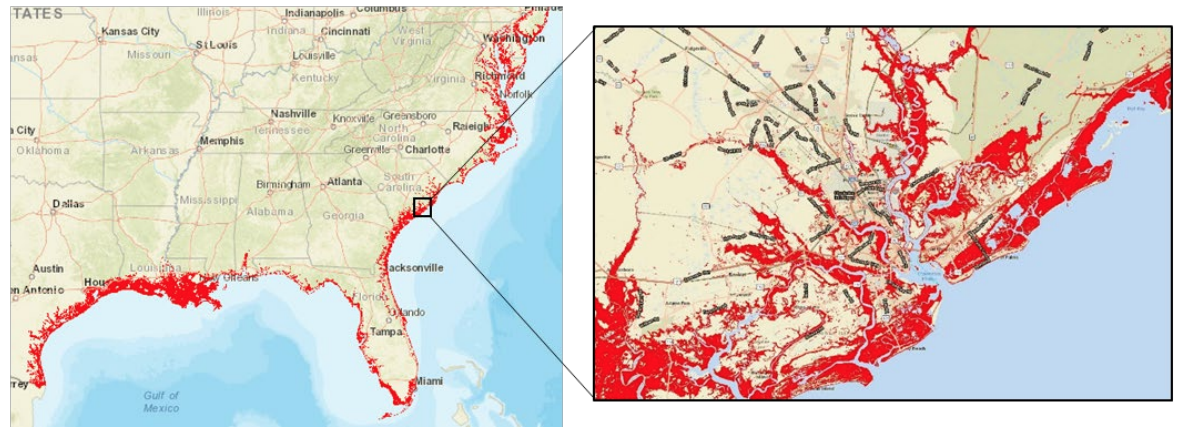
Sea level rise is already affecting coastal communities across the U.S. Flooding during high tides is 300% to 900% more frequent than it was 50 years ago.
In 2019, cities like Miami (Florida), Charleston (South Carolina), Annapolis (Maryland), and Galveston (Texas) experienced 13–18 days of flooding during high tides (Fig. 2.5.3).
However, sea-level rise is not uniform around the world. The map in Fig. 2.5.4 shows the trends from 1993 to 2018. Warm colors indicate places where the sea level is rising faster than average. Cool colors show areas with slower or even falling sea levels.
We’ll explore the reasons behind rising seas and their impacts in a later section. For now, let’s continue our investigation and look at how climate change is affecting extreme weather patterns.