
Did you know that water moves continuously on the Earth? This is known as the water cycle.
Water evaporates from lakes, rivers, oceans, and plants. Then it condenses in the atmosphere to form drops of water. These drops are suspended in the air.
As the condensed drops get bigger, we see them as clouds. And when these drops get big and heavy, they fall to the ground as rain, snow, hail, or sleet -- known as precipitation.
Meteorologists track the amount of water vapor in the atmosphere and the water drops that fall back to the ground as rain or snow.
How Is Precipitation Measured?
Water vapor is measured using humidity sensors on the ground and in the air, on weather balloons. Planes carrying special sensors and satellites also monitor humidity in the atmosphere.
To measure rainfall, scientists use an instrument called the tipping bucket rain gauge. Which is exactly what it sounds like! It is a see-saw-shaped device with a small bucket at either end. Each time the bucket fills up, it tips and spills out water. Then the event is recorded.
Snowfall is recorded by a measuring stick that shows how many inches of snow have fallen in a period of time.
What Does The Data Tell Us?
The atmosphere over the land and the oceans is holding more water vapor than it used to. The figure below shows data from 1973 to 2016.

Since 1901, precipitation around the world has increased. While this has caused flooding in some places, the changing rainfall patterns have led to droughts in others.
Across the U.S, precipitation has increased too with each decade. And just as with temperature, changes in precipitation are not the same across the U.S.
Some places are getting more rain while others are getting way less. Some places are getting rain instead of snow in the winter, like the Pacific Northwest.
The video below shows how scientists track precipitation using satellites. In the next section, we will look at the changes in our world’s oceans.
Summary
- Humidity and precipitation (rain and snow) are measured using ground-based instruments and satellites.
- Data shows humidity and precipitation are increasing over time.
- Changes in precipitation are not uniform -- some areas are getting wetter while others are getting drier.
We have all learned about the water cycle. Also known as the hydrologic cycle, it refers to the continuous movement of water on, above, and below the Earth's surface.
It begins when water evaporates from lakes, rivers, oceans, and even plants (known as transpiration). Once in the atmosphere, the water vapor cools and condenses into tiny droplets suspended in the air.
As these droplets combine and grow, they become visible as clouds. When they grow large and heavy enough, they fall back to the Earth as precipitation -- rain, snow, hail, or sleet.
Meteorologists track both the amount of water vapor in the air and the precipitation that falls back to Earth.
How Is Precipitation Measured?

Water vapor is measured using humidity sensors on the ground and weather balloons in the air. Airplanes with special instruments and satellites in space also measure humidity high up in the atmosphere.
To measure rainfall, scientists often use a tipping bucket rain gauge—a device shaped like a tiny see-saw with a small bucket on each end (Fig. 2.2.2). Each time one bucket fills and tips, it empties the water and sends a signal to record the event.
Snowfall is recorded with a measuring stick that captures how many inches have fallen over a certain period. And here is a fun fact: about 10 inches of snow equals one inch of water.
What Does The Data Tell Us?
From 1973 to 2016, specific humidity – the mass of water vapor in a unit mass of moist air – has increased over both land and oceans. This means the atmosphere now holds more moisture than it used to (Fig. 2.2.3).
Since 1901, global precipitation has risen by an average of 0.08 inches per decade. In some regions, this has caused more flooding, while in others, shifting rainfall patterns have brought more frequent droughts.
In the mainland United States, precipitation has increased by about 0.17 inches per decade, but not evenly everywhere:
- Since 1991, the largest increases in heavy precipitation events (rainfall far above average) have occurred in the Northeast, Midwest, and Great Plains.
- In the Pacific Northwest, more winter precipitation is falling as rain instead of snow.
- The Southwest and Southeast are seeing less rain, snow, and sleet.
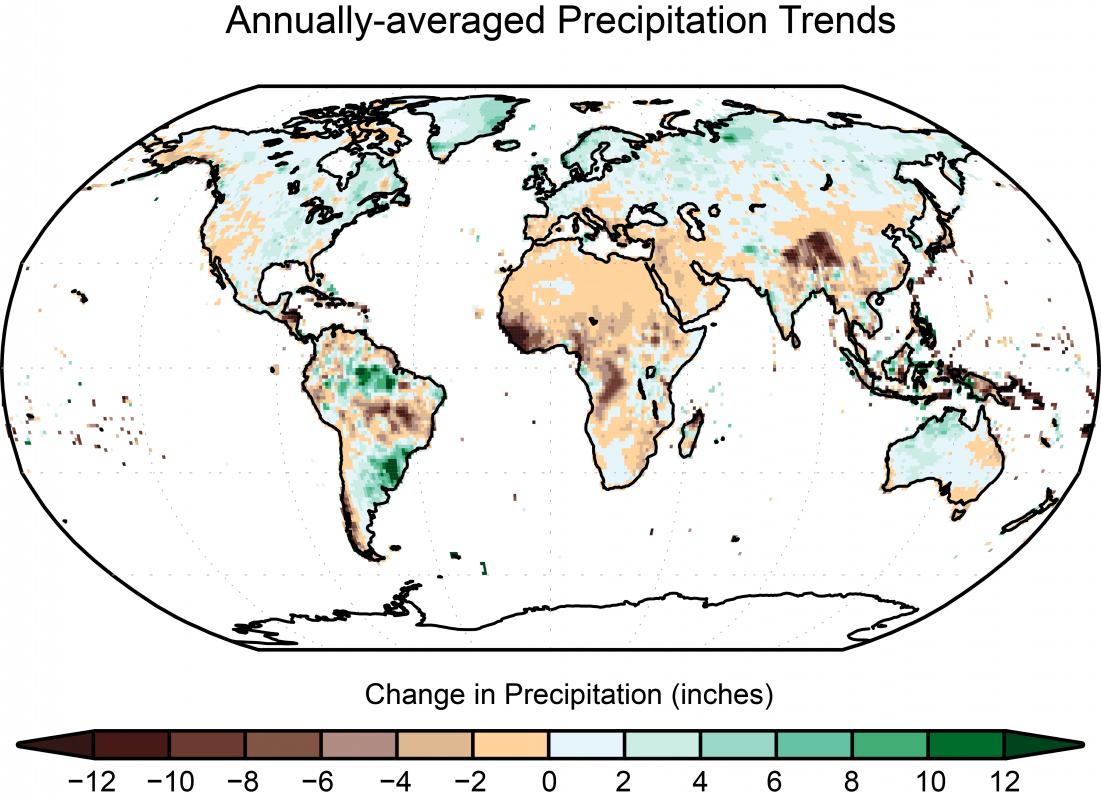
Figure 2.2.4 shows global changes in precipitation from 1986–2015 compared to 1901–1960.
The video below explains how satellites track precipitation. In Module 3, we’ll explore how these changes are connected to climate change. But first, let’s turn to the changes happening in our world’s oceans.