The study of past climate records is called paleoclimatology. Paleoclimate studies use natural records to learn about past climate indirectly. Let’s find out more!
Tree Rings

One paleoclimate record is tree ring data. If you look at a tree stump, you will notice a pattern of light and dark rings – each light and dark pair represents one year of the tree’s growth.
Tree rings grow wider in warm and wet years and narrower in cold and dry years. During years of drought, they are extremely narrow.
By looking at the rings, scientists can find historical patterns of drought, rainfall, and temperatures.
Ice Cores

Ice cores are another natural record. When snow falls on the ground, it carries particles of dust, ash, and pollen that are in the air. In places like Antarctica, the snow accumulates each year. This means that layers of snowfall over millions of years get packed into hard ice.
Scientists dig deep into these Antarctic ice sheets and take out long tubes of ice called “ice cores.” They look at the layers in ice cores for patterns of snowfall and unusually hot summers that cause more ice to melt.
The layers also have bubbles of oxygen and other gases that fell from the atmosphere a long time ago. Things like pollen and dust tell researchers about wind direction or volcanic activity at specific time periods in history.
By pulling out ice cores, scientists can learn a lot about the history of our planet!
Corals

Did you know that corals are alive? They are tiny marine animals that hold secrets about our climate from the past.
A coral is made up of hundreds of thousands of tiny animals called "polyps". Each polyp has a skeleton of calcium carbonate that it makes from salty ocean water.
Much like tree rings, corals also have light and dark bands. The lighter-shaded layers appear during the summer when growth is fast, and darker layers form in the winter when growth slows.
Scientists can also look at trapped oxygen in the shells to learn about temperature and rainfall changes during the corals' lifetime.

The corals that live in shallow waters share a special relationship with tiny, microscopic algae. These algae actually live inside the corals and give them bright colors.
When sudden changes happen in the oceans, it sometimes kills the algae. This is called coral bleaching. The corals actually turn white! The coral bands can also tell us about past bleaching events.
By analyzing corals, scientists can learn about the past going back for hundreds or even thousands of years!
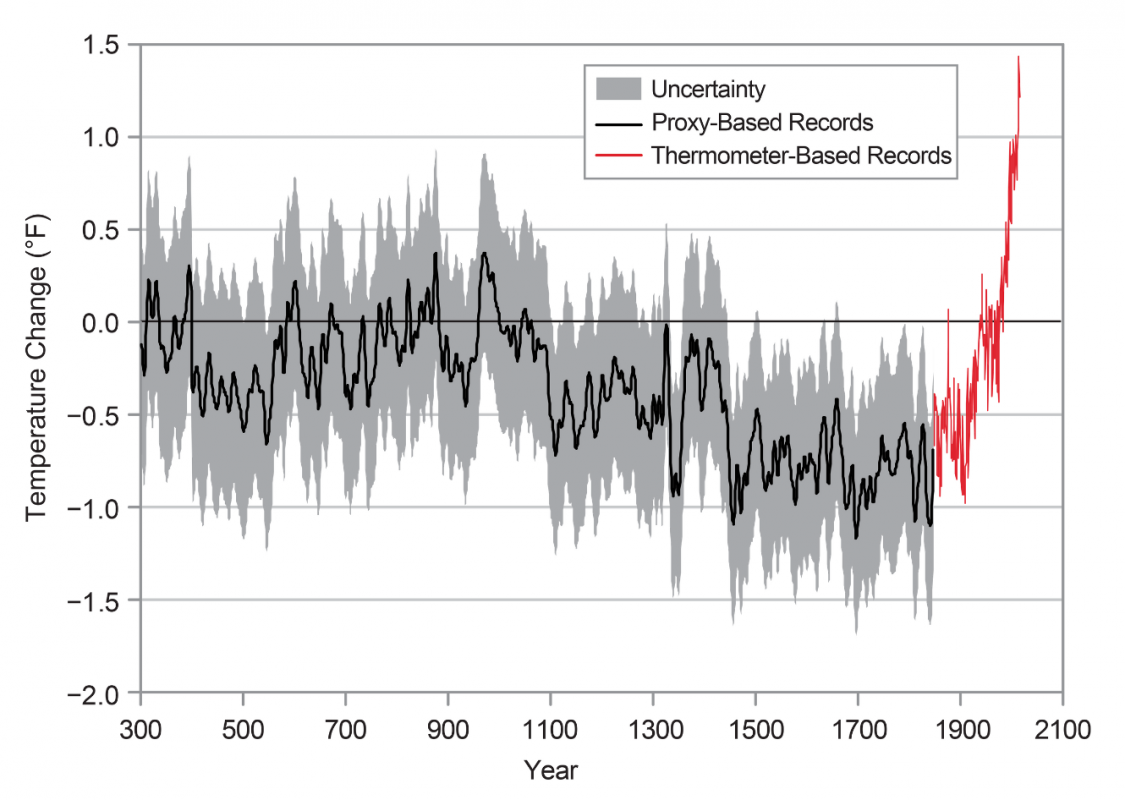
What do these records tell us about the past climate? Figure 1.5.5 shows Earth's temperature over the past 1700 years. The gray bands and black lines are temperatures from natural records, while the red line shows the average temperatures as measured by instruments from the 1880s. What do you notice?
You may have heard people talk about climate change. But for any claim to be credible, it must be backed by data. In the next section, we’ll explore how scientists measure the current health of our planet.
Summary
- We can learn about Earth’s past climate from natural records like tree rings, ice cores, corals, and more.
- They can tell us about the temperature of land and oceans.
- Ice cores can also tell us the amounts of gases and whether there were volcanic eruptions in the past.
The study of past climate records is called paleoclimatology.
Since we don’t have weather records going back thousands or millions of years, scientists rely on clues preserved in nature. These clues provide indirect evidence about the climate of the past.
Let's explore some of these fascinating natural records.
Tree Rings
One of the most common paleoclimate records comes from tree rings.
If you have ever looked at the stump of a tree, you might have seen alternating light and dark rings. Each light-dark pair represents one year of growth.
- In warm, wet years, trees grow faster, and the rings are wider.
- In cold, dry years, growth slows and the rings become narrower, especially during droughts.
By studying these patterns, scientists can reconstruct past conditions like droughts, rainfall levels, and temperature fluctuations (Fig. 1.5.1).
Ice Cores
Ice cores are another powerful window into Earth’s climate history.
As snow falls, it traps tiny particles of dust, ash, and pollen from the atmosphere. In places like Antarctica, snow accumulates year after year, compacting into thick ice sheets over millions of years.
Scientists drill deep into these ice sheets and extract long cylinders called ice cores (Fig. 1.5.3). They examine the layers in ice cores for patterns of snowfall and unusually hot summers.
The light-colored bands represent winter snow, and the dark colored bands represent summer snow (when more melting occurs).

By analyzing oxygen and hydrogen isotopes in the ice, scientists can infer past temperatures. The air bubbles trapped in the layers hold ancient samples of carbon dioxide, methane, and oxygen, giving us a picture of gases in the atmosphere from the distant past.
In addition, trapped pollen or volcanic ash in ice cores gives clues about vegetation, wind patterns, or major volcanic eruptions at specific points in history.
Corals
Corals, which are skeletons of tiny marine animals called polyps, also store climate data going back hundreds to thousands of years. These animals extract calcium carbonate from seawater to build their skeletons.
Like trees, corals grow in bands. Light bands form in summer, during fast growth. Dark bands form in winter, when growth slows. Scientists study these bands to understand seasonal climate changes.
By analyzing the trapped oxygen isotopes in coral shells, researchers can estimate ocean temperatures during different periods of a coral’s life.
Also, corals have a close relationship with microscopic algae that give them their brilliant colors. When the ocean becomes too warm or acidic, the algae die, causing the corals to turn white. This process is known as coral bleaching. These events are also recorded in the coral’s growth bands.
Other Natural Records
A few lesser-known but equally important sources of paleoclimate data include:
- Lake and ocean sediments, which accumulate layers of organic material, pollen, and minerals
- Fossils, which offer evidence of ancient ecosystems and climate conditions
- Historical documents, such as farmers’ almanacs or ship logs, which capture weather observations
What can we learn from these records?
Figure 1.5.6 (below) shows Earth's temperature over the past 1,700 years. The gray bands and black lines represent reconstructed temperatures from natural records. The red line shows measured temperatures from scientific instruments since the 1880s. What do you notice?
You may have heard people talk about climate change. Any claim has to be grounded in data, and in the next section, we look at how scientists measure the health of our planet.